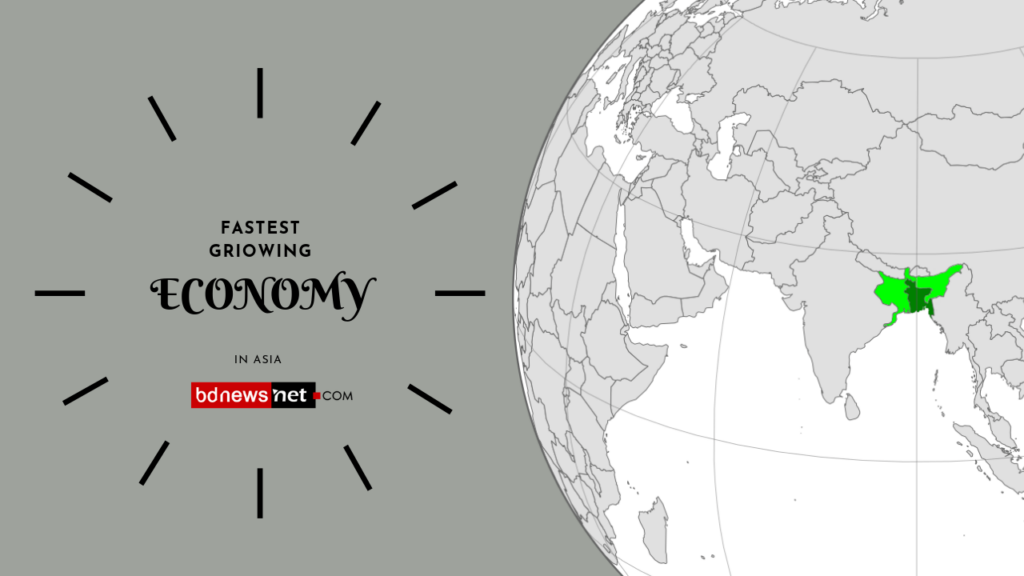
The economy of Bangladesh is moved forward rapidly in the last 10 years . According to the World Economic Forum Bangladesh’s economy is growing faster than neighboring India, Nepal, Sri Lanka, Pakistan & Maldives . The per capita income of the people of Bangladesh has increased due to the declining population growth rate . Since 2014, the country’s population has been growing at a rate of one percent per year , Bangladesh currently has GDP per capita $2,068 , in terms of purchasing power parity $5,453 .
According to a report by the World Bank, Bangladesh is one of the nine countries in the world that have achieved a GDP growth rate of more than 6 percent in 2019 . Once the Padma Bridge and mega projects are implemented, it is expected to boost the GDP of Bangladesh by as much as 1.2 percent. After independence in 1971 Foreign currency it was almost zero. Now Foreign currency reserves have gone from nominal to 30-31.The total number of Mobile Phone subscribers in Bangladesh has reached 166.114 Million at the end of February, 2020 .
Bangladesh’s economy is 39th in the world and 29th in terms of purchasing power parity and 2nd in South Asia. The economy of Bangladesh is moving forward by leaps and bounds . Its the eighth-most populated country in the world with almost 2.2% of the world’s population . The GDP of Bangladesh is $317.465 billion in 2019 . The garment industry , which contributes the most to the economic development of Bangladesh , is playing an important role in the country’s development. 7-8% of the total growth comes from the garment sector. The garment sector accounts for 16% of Bangladesh’s total GDP, Agriculture and forestry account for more than 14 per cent .
75 percent of the country’s exports come from the readymade garments sector. The size of this sector stands at 30 billion dollars.according to a report released by the Center for Economics and Business Research (CEBR) Bangladesh’s economy is set to become the world’s 30th largest by 2024, surpassing Malaysia, Hong Kong and Singapore .
According to the Bangladesh Economic Survey 2019, the total workforce of Bangladesh engaged in agriculture is 40.6% . 48.61 percent of households in Bangladesh are dependent on agriculture .According to the data of the Ministry of Agriculture till January 2020, Bangladesh is the 3rd, 4th and 8th in the world in vegetable, paddy and potato production respectively. It also ranks 4th in fish, 7th in mango, 8th in guava and 10th in food grain production in the world .
| GDP | $317.465 billion (2019 |
| GDP (PPP) | $860.916 billion |
| GDP by Sector | (Percentage of GDP) |
| Agriculture | 13.32% |
| Industry | 31.15% |
| Service | 55.53% |
| GDP Growth | 8.0% (2018) 7.9% (2019) 2.0% (2020e) 9.5% (2021e |
| Unemployment rate | 4.18% (2016) |
| Inflation | 5.564% |
| GDP per capita | $2,068 (nominal, 2020 est.) |
| Exports | $40.53 billion (July 2018- June 2019) |
| Imports | $55.44 billion (July 2018- June 2019) |
| Mobile Phone subscribers | 166.114 million |
| Government borrowings | 33.1% of GDP (2017 est.) |
| Foreign reserves | $32 billion (July 2019 |
Bangladesh has achieved GDP growth at an average rate of 7.3 percent over the past decade and is currently the 7th fastest growing economy in the world. In 2019, Bangladesh was the 42nd largest exporter in the world in terms of export earnings. In 2016, Bangladesh’s share in the global garment market was 6 percent and it was the second largest country in the world in terms of garment exports. In 2019, the contribution of goods and services export sector to the GDP of Bangladesh was 14.6% .
Sectoral Shares of Gross Domestic Product (GDP) of Bangladesh in Percentage
| GDP Sector | 2015-16 | 2016-17 | 2017-18 | 2018-19 |
| A)Agriculture Sector of Bangladesh | 14.77 | 14.17 | 13.82 | 13.32 |
| AGRICULTURE AND FORESTRY | 11.55 | 10.98 | 10.68 | 10.25 |
| Crops & horticulture | 8.15 | 7.69 | 7.48 | 7.12 |
| Animal Farmings | 2.01 | 1.93 | 1.86 | 1.79 |
| Forest and related services | 1.39 | 1.37 | 1.34 | 1.35 |
| FISHING | 3.22 | 3.19 | 3.14 | 3.07 |
| B) Industry Sector | 28.77 | 29.32 | 30.17 | 31.15 |
| MINING AND QUARRYING | 1.73 | 1.83 | 1.83 | 1.82 |
| Natural gas and crude petroleum | 0.65 | 0.64 | 0.62 | 0.58 |
| Other mining & coal | 1.08 | 1.18 | 1.2 | 1.24 |
| MANUFACTURING | 17.91 | 18.28 | 18.99 | 19.89 |
| Large & medium scale | 14.58 | 14.93 | 15.63 | 16.37 |
| Small scale | 3.34 | 3.35 | 3.36 | 3.52 |
| ELECTRICITY, GAS AND WATER SUPPLY | 1.45 | 1.4 | 1.38 | 1.33 |
| Electricity | 1.12 | 1.09 | 1.07 | 1.04 |
| Gas | 0.26 | 0.24 | 0.24 | 0.22 |
| Water | 0.07 | 0.07 | 0.07 | 0.07 |
| CONSTRUCTION | 7.67 | 7.81 | 7.98 | 8.12 |
| C. Service Sector of Bangladesh | 56.46 | 56.5 | 56 | 55.53 |
| WHOLESALE AND RETAIL TRADE; REPAIR OF MOTOR VEHICLES, MOTORCYCLES AND PERSONAL AND HOUSEHOLD GOODS | 13.01 | 13.05 | 13.15 | 13.34 |
| HOTEL AND RESTAURANTS | 1.04 | 1.03 | 1.04 | 1.04 |
| TRANSPORT, STORAGE & COMMUNICATION | 10.27 | 10 | 9.61 | 9.34 |
| Land Transport | 7.76 | 7.64 | 7.38 | 7.22 |
| Water transport | 0.62 | 0.59 | 0.55 | 0.51 |
| Air transport | 0.08 | 0.07 | 0.07 | 0.07 |
| Support transport services, storage | 0.49 | 0.47 | 0.46 | 0.44 |
| Post and Tele communications | 1.32 | 1.24 | 1.16 | 1.1 |
| FINANCIAL INTERMEDIATIONS | 3.86 | 3.91 | 3.93 | 3.89 |
| Monetary intermediation (Banks) | 3.27 | 3.34 | 3.37 | 3.35 |
| Insurance | 0.38 | 0.36 | 0.34 | 0.34 |
| Other financial auxilliaries | 0.21 | 0.21 | 0.22 | 0.21 |
| REAL ESTATE, RENTING AND BUSINESS ACTIVITIES | 7.51 | 7.73 | 7.82 | 7.87 |
| PUBLIC ADMINISTRATION AND DEFENCE | 4.05 | 4.19 | 4.24 | 4.09 |
| EDUCATION | 2.82 | 3.04 | 3.03 | 3.02 |
| HEALTH AND SOCIAL WORKS | 2.11 | 2.08 | 2.07 | 2.15 |
| COMMUNITY, SOCIAL AND PERSONAL SERVICES | 11.79 | 11.46 | 11.11 | 10.78 |
Development Expenditure of the Government by Sector
In million Tk.) Source : Compiled by National Accounting Wing, BBS
| Sectors | 2009-10 | 2010-11 | 2011-12 | 2012-13 | 2013-14 | 2014-15 | 2015-16 | 2016-17 |
| Agriculture | 16389 | 20934 | 19800 | 26962 | 28020 | 34351 | 5520 | 66412 |
| Industry | 4428 | 3518 | 4471 | 17137 | 17810 | 21834 | 17558 | 21124 |
| Flood Control and Water Resources | 10768 | 11553 | 12800 | 15934 | 16560 | 20302 | 24500 | 29476 |
| Rural Institution | 36267 | 44734 | 42736 | 67714 | 70373 | 86275 | 38995 | 46916 |
| Power and | ||||||||
| Natural Resources | 33352 | 69028 | 67548 | 104978 | 109100 | 133752 | 153859 | 185111 |
| Transport | 35265 | 38471 | 52642 | 82081 | 85304 | 104579 | 177482 | 213532 |
| Communication | 3808 | 2618 | 7454 | 6851 | 7120 | 8728 | 12741 | 15328 |
| Education and Training | 41548 | 48792 | 52130 | 65345 | 68950 | 84530 | 94460 | 113647 |
| Health | 27110 | 28652 | 30270 | 35088 | 36466 | 44706 | 47625 | 57298 |
| Population Control and Family Planning and Housing | 38743 | 43204 | 50930 | 58440 | 60734 | 74457 | 155635 | 187248 |
| Others * | 11492 | 17046 | 7719 | 19823 | 19563 | 23986 | 86845 | 104488 |
| Total | 259170 | 328550 | 348500 | 500353 | 520000 | 637500 | 864900 | 1040580 |
Development Expenditure of the Bangladesh Government by Sector
Notes : * Others include social welfare, labour training , Science and technology, Research and public administration
Bangladesh’s Commodity wise export shipments
In million US
| Bangladesh’s Commodity wise export shipments | 2018-19 July-Jan | 2019-20P July-Dec | 2019-20P July-Jan |
|---|---|---|---|
| A. Frozen food | 361.09 | 290.50 | 337.33 |
| 1. Fish | 40.80 | 42.97 | 52.29 |
| 2. Shrimps | 257.41 | 217.20 | 247.71 |
| 3. Others | 62.88 | 30.33 | 37.33 |
| B. Agricultural products | 658.43 | 612.52 | 681.66 |
| 1. Raw jute | 78.82 | 88.62 | 102.05 |
| 2. Vegetables | 64.78 | 128.79 | 132.83 |
| 3. Tobacco | 49.68 | 55.83 | 60.55 |
| 4. Cut flower | 3.98 | 0.02 | 0.02 |
| 5. Fruits | 0.28 | 0.48 | 0.48 |
| 6. Others | 460.89 | 338.78 | 385.73 |
| C. Manufactured products | 23160.07 | 18399.14 | 21900.48 |
| 1. Petrolium bi-products | 177.28 | 12.78 | 15.14 |
| 2. Chemical products | 124.78 | 109.78 | 126.25 |
| 3. Plastic products | 67.06 | 56.86 | 66.42 |
| 4. Leather & Leather Products (Other than Leather Footwear) | 242.12 | 191.50 | 225.76 |
| 5. Cotton & cotton products | 86.42 | 80.68 | 93.25 |
| 6. Jute goods | 419.84 | 423.11 | 500.44 |
| 7. Specialised textiles | 84.03 | 65.78 | 75.65 |
| 8. Knitwear | 10140.58 | 8205.80 | 9620.02 |
| 9. Woven garments | 10076.90 | 7818.22 | 9443.22 |
| 10. Home textile | 490.20 | 370.10 | 442.67 |
| 11. Footwear | 534.62 | 441.44 | 521.92 |
| 12. Engineering products | 199.36 | 168.04 | 194.82 |
| 13. Ships, boats & floating structures | 0.17 | 0.17 | 11.25 |
| 14. Others | 516.71 | 454.88 | 563.67 |
| Total (A+B+C) | 24179.59 | 19302.16 | 22919.47 |
| Of which exports from EPZ | 3507.48 | 2924.41 | 3445.97 |
Foreign Direct Investment (FDI) in Bangladesh
| FDI stock classified by Major Countries and Major Sectors | Gas & Petroleum | Textile and Wearing | Power | Banking | Food | Teleco m | Trading | Leather | Cement | Agriculture | Computer Software and IT | Chemicals and Pharmaceuticals | NBFI (Including Financial Intermediaries) | Insurance | Construction | Other sectors | Total FDI Stock |
| United States of America (USA) | 2769.7 | 52.95 | 171.65 | 189.94 | 3.07 | 6.57 | 60.34 | 0.05 | — | 1.42 | 10.95 | 0.37 | 31.39 | 197.72 | 2.38 | 41.52 | 3540.02 |
| United Kingdom (UK) | — | 399.91 | 1123.79 | 163.14 | 288.24 | 0.39 | 0.82 | 0.35 | — | 73.15 | 0.37 | 117.29 | 19.57 | — | 0.45 | 84.51 | 2271.98 |
| Netherlands | 7.87 | 112.36 | 9.15 | 189.59 | 727.33 | 1.31 | 55.75 | 47.97 | 115.24 | 0.07 | 0.07 | — | — | — | 12.79 | 105.75 | 1385.25 |
| Singapore | 43.32 | 158.05 | 7.55 | 337.88 | 57.07 | -33.92 | 109.88 | 0.01 | — | 40.5 | 8.68 | 9.87 | 94.24 | — | 13.22 | 345.59 | 1191.94 |
| South Korea | — | 810.91 | 89.7 | 0.13 | 0.14 | — | 36.9 | 109.27 | — | — | — | -0.13 | — | — | 1.26 | 52.09 | 1100.27 |
| Hong Kong: SAR of China | — | 512.95 | 77.38 | 7.26 | 0.47 | 0.2 | 29.46 | 48.44 | 42.81 | 1.22 | 0.54 | 0 | 0.66 | — | 0.01 | 151.79 | 873.19 |
| China People’s Republic (P.R) | — | 197.46 | — | 369.68 | 0.71 | 0 | 36.49 | 35.44 | — | 1.26 | 0.67 | 2.55 | — | — | 20.65 | 200.22 | 865.13 |
| Australia | 842.47 | 0.15 | — | — | — | — | 0.03 | — | — | 0.54 | 0.03 | 0.35 | — | — | — | 2.83 | 846.4 |
| Malaysia | 0.01 | 16.85 | — | 1.99 | -0.06 | 514.12 | 0.32 | 1.48 | — | — | 228.74 | 1.66 | 3.92 | — | 23.72 | 20.86 | 813.61 |
| India | — | 88.87 | 127.64 | 61.98 | 17.49 | 153.93 | 23.08 | 1.21 | — | 7.61 | -1.12 | 27.59 | — | 6.31 | 3.88 | 100.25 | 618.72 |
| Japan | 15.24 | 33.78 | 1.44 | 24.33 | 3.3 | 47.2 | 12.76 | 10.26 | 62.31 | 0.11 | 5.64 | 9.75 | — | — | 33.4 | 191.44 | 450.96 |
| Taiwan: Province of China | — | 118.92 | — | — | 3.43 | — | 12.96 | 135.94 | — | — | — | 0.25 | — | — | 3.95 | 77.74 | 353.19 |
| Sri Lanka | — | 61.28 | 167.71 | 61.41 | 2.31 | — | 2.72 | — | — | -0.9 | 0.79 | 0.48 | 9.8 | — | 0.39 | 28.09 | 334.08 |
| British Virgin Islands | — | 252.64 | — | 3.29 | — | — | 3.07 | — | — | 0.02 | 0.18 | 1.07 | 7.1 | — | — | 65.97 | 333.34 |
| Thailand | — | 0.88 | — | — | 12.35 | — | 0.1 | — | 28.68 | 158.07 | — | 0.53 | 0.12 | — | 40.01 | 31.6 | 272.34 |
| United Arab Emirates (UAE) | 1.67 | 5.94 | 35.62 | 41.97 | 2.26 | -0.1 | 21.36 | — | 23.03 | — | 9.88 | 1.47 | 11.54 | — | 29.82 | 77.55 | 262.01 |
| Saudi Arabia | 0.01 | — | 199.82 | — | — | — | 0.02 | — | — | — | — | — | 58.68 | — | — | 0.07 | 258.6 |
| Mauritius | — | 128.91 | — | 63.85 | — | 5.45 | 2.29 | — | — | — | 0.26 | 0.02 | — | — | 2.13 | 35.77 | 238.68 |
| Pakistan | 0.02 | -7.76 | 191.97 | — | — | — | 0.13 | 0.03 | — | — | — | — | — | — | -0.08 | 30.1 | 214.41 |
| Norway | — | — | 29.03 | — | — | 140.12 | 3.48 | — | 0.34 | — | 0.28 | — | — | — | — | 9.92 | 183.17 |
| Other Countries | 71.04 | 304.97 | 50.29 | 42 | 45.47 | 25.86 | 26.01 | 16.77 | 19.61 | 1.79 | 3.73 | 73.3 | 7.29 | — | 4.71 | 210.67 | 903.51 |
| Total FDI Stock | 3751.35 | 3250.02 | 2282.74 | 1558.44 | 1163.58 | 861.13 | 437.97 | 407.22 | 292.02 | 284.86 | 269.69 | 246.42 | 244.31 | 204.03 | 192.69 | 1864.33 | 17310.8 |
FDI stock classified by Major Countries and Major Sectors as on End of Sep, 2019
-Foreign Investment & External Debt (FIED) Management Cell, Statistics Department, Bangladesh Bank