Bangladesh Business News
2019 Bangladesh Budget & Economy in Brief

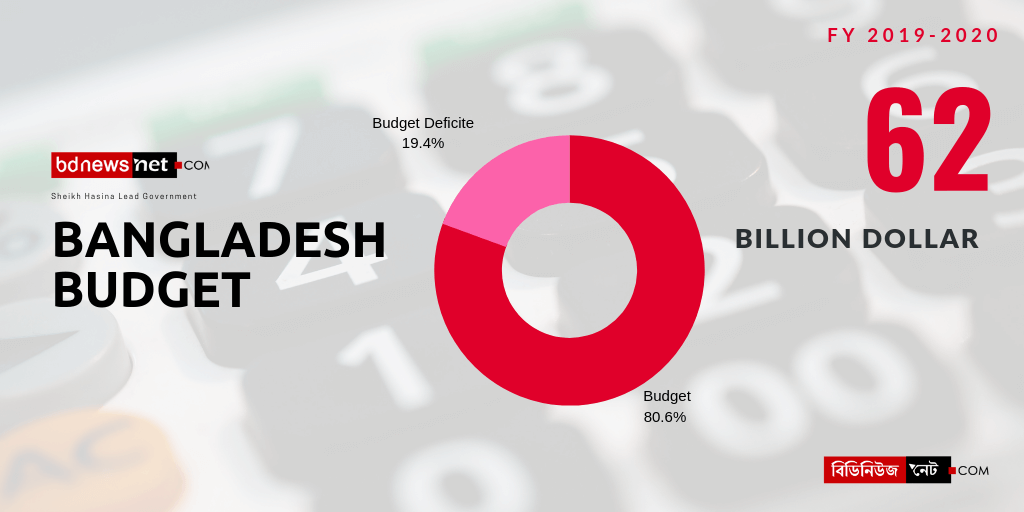
The size of the proposed budget for Bangladesh FY 2019-20 is 62 Billion dollars. . The debt to GDP ratio is 32 percent. The country achieved self-sufficiency in food by raising foodgrains production to 2 crore 68 lakh metric tons.
The size of GDP is US$ 302.4 billion. The budget deficit for the current fiscal year was estimated at USD 14.92 Billion which is 5.0 percent of GDP. The share of the population enjoying electricity connection has now gone up to 93 percent. There are 4 crore people in Bangladesh who are included in the middle-income group. However, the number of taxpayers is only 21-22 lakh. Imports in now to US$ 58.9 billion exports US$ 37 billion in FY2017-18 .
Budget 2019 by Ministry
Hollis B. Chenery, an American Professor of Economics, commented in 1973 that Bangladesh’s per capita income will take 125 years to reach US$ 900. It reached US$ 928 in 2011 and now stands at US$ 1,909. The literacy rate is currently 72.9 percent. The power generation capacity has now increased to 21,629 megawatts. Gas supply has now increased to 2,746 million cubic feet per day. targets to generate 24,000 megawatts by 2021, 40,000 megawatts by 2030, and 60,000 megawatts by 2041 .
Billions dollar mega project like the Padma Bridge, Padma Rail Link Project, Dohajari-Cox’s Bazar rail line, Rooppur Nuclear Power Plant, Rampal Power Plant, Payra Sea Port, Matarbari Power Plant at Moheshkhali, and Dhaka Metro Rail is underway.
Budget allocation in Corror Taka
| Ministry/Division | Budget 2019-20 | Revised 2018-19 |
| President’s Office | 24 | 23 |
| National Parliament | 328 | 299 |
| Prime Minister’s Office | 3,528 | 2,818 |
| Cabinet Division | 241 | 155 |
| Supreme Court | 195 | 213 |
| Election Commission Secretariat | 1,921 | 4,343 |
| Ministry of Public Administration | 2,938 | 2,854 |
| Bangladesh Public Service Commission | 102 | 128 |
| Finance Division | 1,30,810 | 95,682 |
| Office of the Comptroller and Auditor General of Bangladesh | 238 | 217 |
| Internal Resources Division | 2,899 | 2,320 |
| Financial Institutions Division | 3,042 | 2,237 |
| Economic Relations Division | 4,560 | 3,730 |
| Planning Division | 1,231 | 513 |
| Implementation Monitoring & Evaluation Division | 149 | 145 |
| Statistics and Informatics Division | 375 | 741 |
| Ministry of Commerce | 632 | 486 |
| Ministry of Foreign Affairs | 1,621 | 1,402 |
| Ministry of Defense | 32,520 | 30,670 |
| Armed Forces Division | 38 | 34 |
| Law and Justice Division | 1,651 | 1,577 |
| Public Security Division | 21,920 | 22,099 |
| Legislative and Parliamentary Affairs Division | 35 | 38 |
| Ministry of Primary and Mass Education | 24,040 | 20,521 |
| Secondary and Higher Education Division | 29,624 | 25,866 |
| Ministry of Science and Technology | 16,439 | 12,391 |
| Health Service Division | 19,944 | 17,269 |
| Information and Communication Technology Division | 1,930 | 1,737 |
| Ministry of Social Welfare | 6,881 | 5,582 |
| Ministry of Women and Children Affairs | 3,749 | 3,457 |
| Ministry of Labour and Employment | 313 | 271 |
| Ministry of Housing and Public Works | 6,603 | 6,146 |
| Ministry of Information | 989 | 928 |
| Ministry of Cultural Affairs | 576 | 625 |
| Ministry of Religious Affairs | 1,338 | 1,495 |
| Ministry of Youth and Sports | 1,485 | 1,519 |
| Local Government Division | 34,241 | 30,696 |
| Rural Government and Co-operatives Division | 2,449 | 2,266 |
| Ministry of Industries | 1,556 | 1,572 |
| Ministry of Expatriates Welfare and Overseas Employment | 591 | 596 |
| Ministry of Textiles and Jute | 800 | 1,614 |
| Energy and Mineral Resources Division | 1,986 | 2,290 |
| Ministry of Agriculture | 14,053 | 12,792 |
| Ministry of Fisheries and Livestock | 2,932 | 1,782 |
| Ministry of Environment, Forest and Climate Change | 1,495 | 1,339 |
| Ministry of Land | 1,943 | 1,760 |
| Ministry of Water Resources | 7,932 | 7,679 |
| Ministry of Food | 4,814 | 4,316 |
| Ministry of Disaster Management and Relief | 9,871 | 9,718 |
| Road Transport and Highways Division | 29,274 | 23,485 |
| Ministry of Railway | 16,277 | 11,246 |
| Ministry of Shipping | 3,833 | 4,214 |
| Ministry of Civil Aviation and Tourism | 3,426 | 1,071 |
| Posts and Telecommunications Division | 3,456 | 2,835 |
| Ministry of Chittagong Hill Tracts Affairs | 1,194 | 1,360 |
| Power Division | 26,065 | 24,212 |
| Ministry of Liberation War Affairs | 4,453 | 3,848 |
| Anti Corruption Commission | 140 | 123 |
| Bridges Division | 8,564 | 6,346 |
| Technical and Madrasha Education Division | 7,454 | 5,758 |
| Security Services Division | 3,694 | 4,025 |
| Ministry of Health and Family Welfare | 5,788 | 5,067 |
| Total | 5,23,190 | 4,42,541 |
Economy of Bangladesh
- Bangladesh Crude Oil Production at 3.00 BBL/D/1
- Bangladesh Private Sector Credit at 9546.80 BDT Billion
- Bangladesh Mining Production at 2.70 percent
- Bangladesh Manufacturing Production at 13.00 percent
- Bangladesh Electricity Production at 4174.00 Gigawatt-hour
- Bangladesh Money Supply M3 at 1474424.60 BDT Million
- Bangladesh – Credit Rating at 40.00
- Bangladesh Repo Rate at 6.00 percent
- Bangladesh Gold Reserves at 14.00 Tonnes
- Bangladesh Consumer Credit at 10962.60 BDT Billion
- Bangladesh Balance of Trade at -145.30 BDT Billion
- Bangladesh Exports at 271.64 BDT Billion
- Bangladesh Imports at 416.96 BDT Billion
- Bangladesh Loans to Private Sector at 9298.35 BDT Billion
- Bangladesh Capital Account at 0.02 BDT Billion
- Bangladesh Money Supply M1 at 2517129.00 BDT Million
- Bangladesh Money Supply M0 at 1595.00 BDT Billion
- Bangladesh Money Supply M2 at 11685.79 BDT Billion
- Bangladesh Average One Month Interbank Rate at 4.57 percent
- tBangladesh Foreign Exchange Reserves at 32122.90 USD Million
GDP Growth Rate of Bangladesh by Year
| Fiscal Year | GDP Growth (%) |
| 2010-11 | 6.46 |
| 2011-12 | 6.52 |
| 2012-13 | 6.01 |
| 2013-14 | 6.06 |
| 2014-15 | 6.55 |
| 2015-16 | 7.11 |
| 2016-17 | 7.28 |
| 2017-18 | 7.86 |
| 2018-19 | 8.13 |
| 2019-20 (Projec tion) | 8.2 |
Power Generation Capacity of Bangladesh by year
| Fiscal Year | Power Generation Capacity (Megawatt) |
| 2010-11 | 7,264 |
| 2011-12 | 8,716 |
| 2012-13 | 9,151 |
| 2013-14 | 10,416 |
| 2014-15 | 11,534 |
| 2015-16 | 14,429 |
| 2016-17 | 15,379 |
| 2017-18 | 18,753 |
| 2018-19 | 21,629 |
| 2019-20 (Projec tion) | – |
Inflation in Bangladesh By Year
| Fiscal Year | Average Inflation |
| 2010-11 | 10.9 |
| 2011-12 | 8.7 |
| 2012-13 | 6.8 |
| 2013-14 | 7.4 |
| 2014-15 | 6.4 |
| 2015-16 | 5.9 |
| 2016-17 | 5.4 |
| 2017-18 | 5.8 |
| 2018-19 | 5.4a |
| 2019-20 (Projec tion) | 5.5 |
Per Capita Income of Bangladesh By Year
| Fiscal Year | Per Capita Income (US$) |
| 2010-11 | 928 |
| 2011-12 | 955 |
| 2012-13 | 1,054 |
| 2013-14 | 1,184 |
| 2014-15 | 1,316 |
| 2015-16 | 1,465 |
| 2016-17 | 1,610 |
| 2017-18 | 1,751 |
| 2018-19 | 1,905P |
| 2019-20 (Projec tion) | 2173 |
Food Grain Production in Bangladesh By Year
| Fiscal Year | Food Grain Production (Lakh Metric Ton) |
| 2010-11 | 360.7 |
| 2011-12 | 368.8 |
| 2012-13 | 372.7 |
| 2013-14 | 381.7 |
| 2014-15 | 384.2 |
| 2015-16 | 388.2 |
| 2016-17 | 386.3 |
| 2017-18 | 404.03 |
| 2018-19 | 429.93* |
| 2019-20 (Projec tion) | – |
.


